Grafora: dashboards
Dashboards that show what is behind a number.
Interactive dashboards on your own data. Click a number and you see the rows behind it, and why a figure is what it is.
Always the current state
Straight on your own database, without exports or copies. Data from other systems comes in through data integration.
From number to detail in one click
Click a bar, number or row and you see the rows behind it. Drill down, filter the whole dashboard with one click, or export the rows.
See why
On time at 86 percent? Grafora shows at once what caused it, so you know where to adjust.
On your phone too
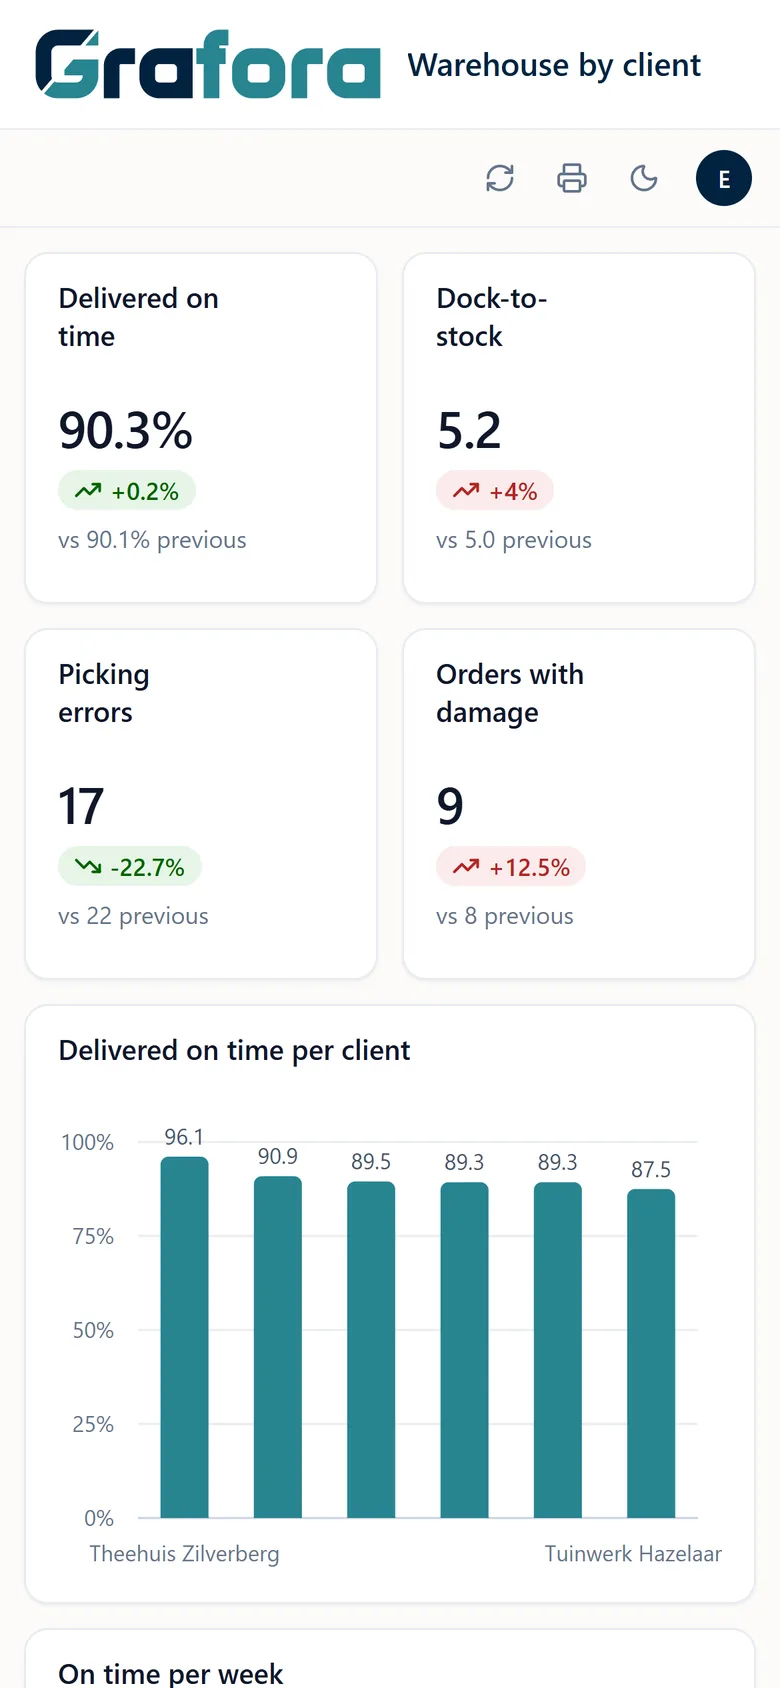
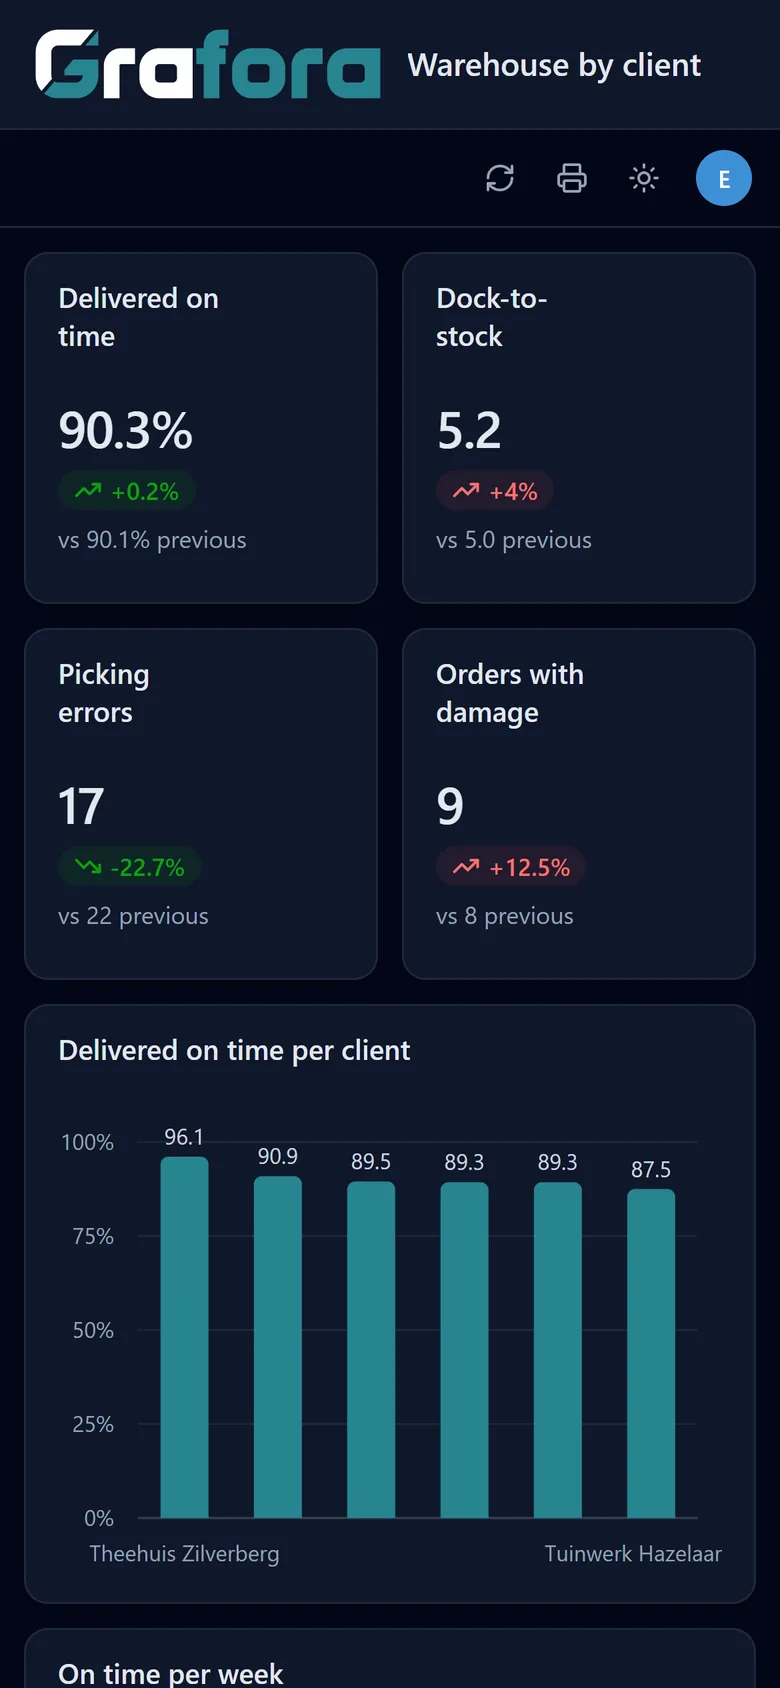
Every dashboard fits the screen, so you see the figures on the road too.
Capabilities
Everything you need in a dashboard
Charts and key figures
From bar and line to gauge and radar, with the trend against the previous period.
Tables and forms
Viewing and entering on the same dashboard.
Maps
Locations and spread at a glance.
More of Grafora
- Power BI alternative One platform for reports and apps
- Emergency viewer Keep working when your main system is down
- Overview The platform in brief
- Data apps Enter and approve on your own data
- Data integration All your systems connected, automatically
- Record pages and printing Records on screen, phone and paper
- Dex, the AI assistant Build a dashboard from a sentence
- Security and audit Microsoft Entra, rights and an audit trail
- Hosting In the EU or in your own Azure
What can Grafora do for your organisation?
In a half-hour call we show Grafora on a situation like yours.